Analytics
On the Analytics tab you can access the built-in Kibana interface, including some additional capabilities to support queries over large datasets:
- Query Progress bar (track progress status of the query)
- Dataset Size counter (display the size of the dataset covered by the query)
- Cancel button (cancel the query at any time)
ChaosSearch built-in Kibana is based on the Open Distro open-source project.
Select the Analytics tab at the top of the screen to continue.
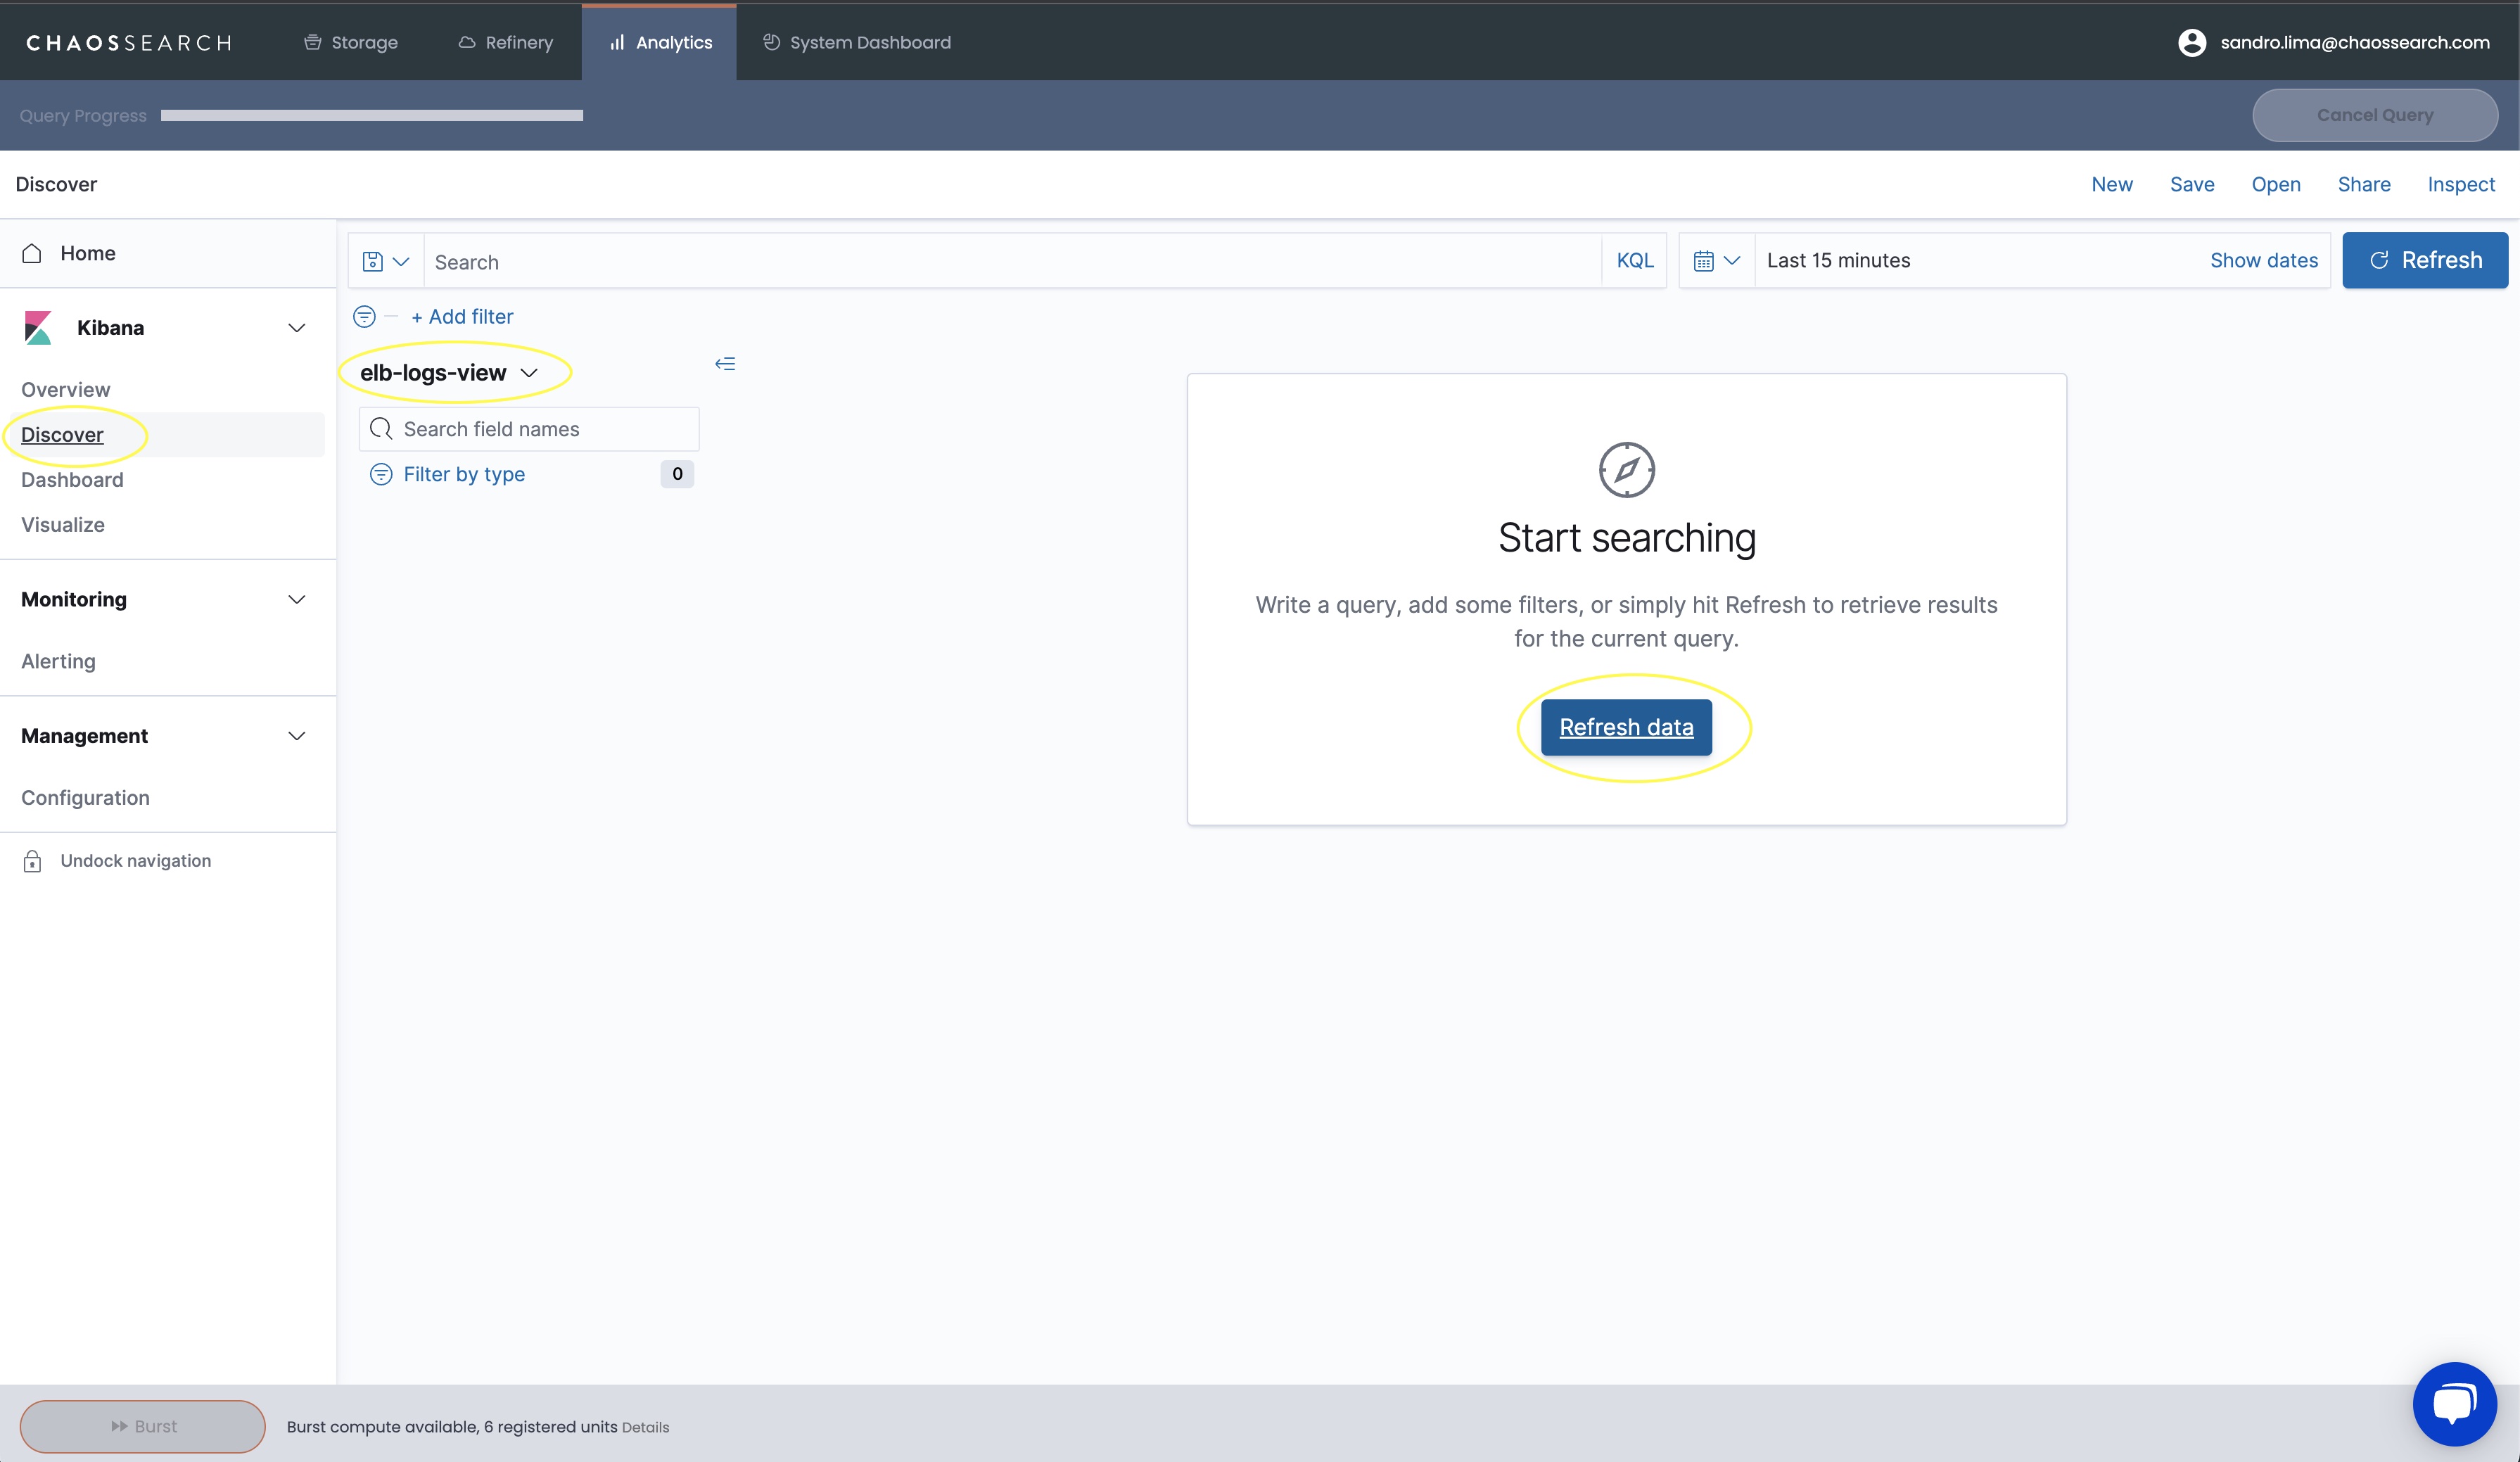
Discover the data
On the left side of the screen, select Discover.
On the drop-down list, select the View you created on the previous step.
Finally, click Refresh in the middle of the screen to show the logs.
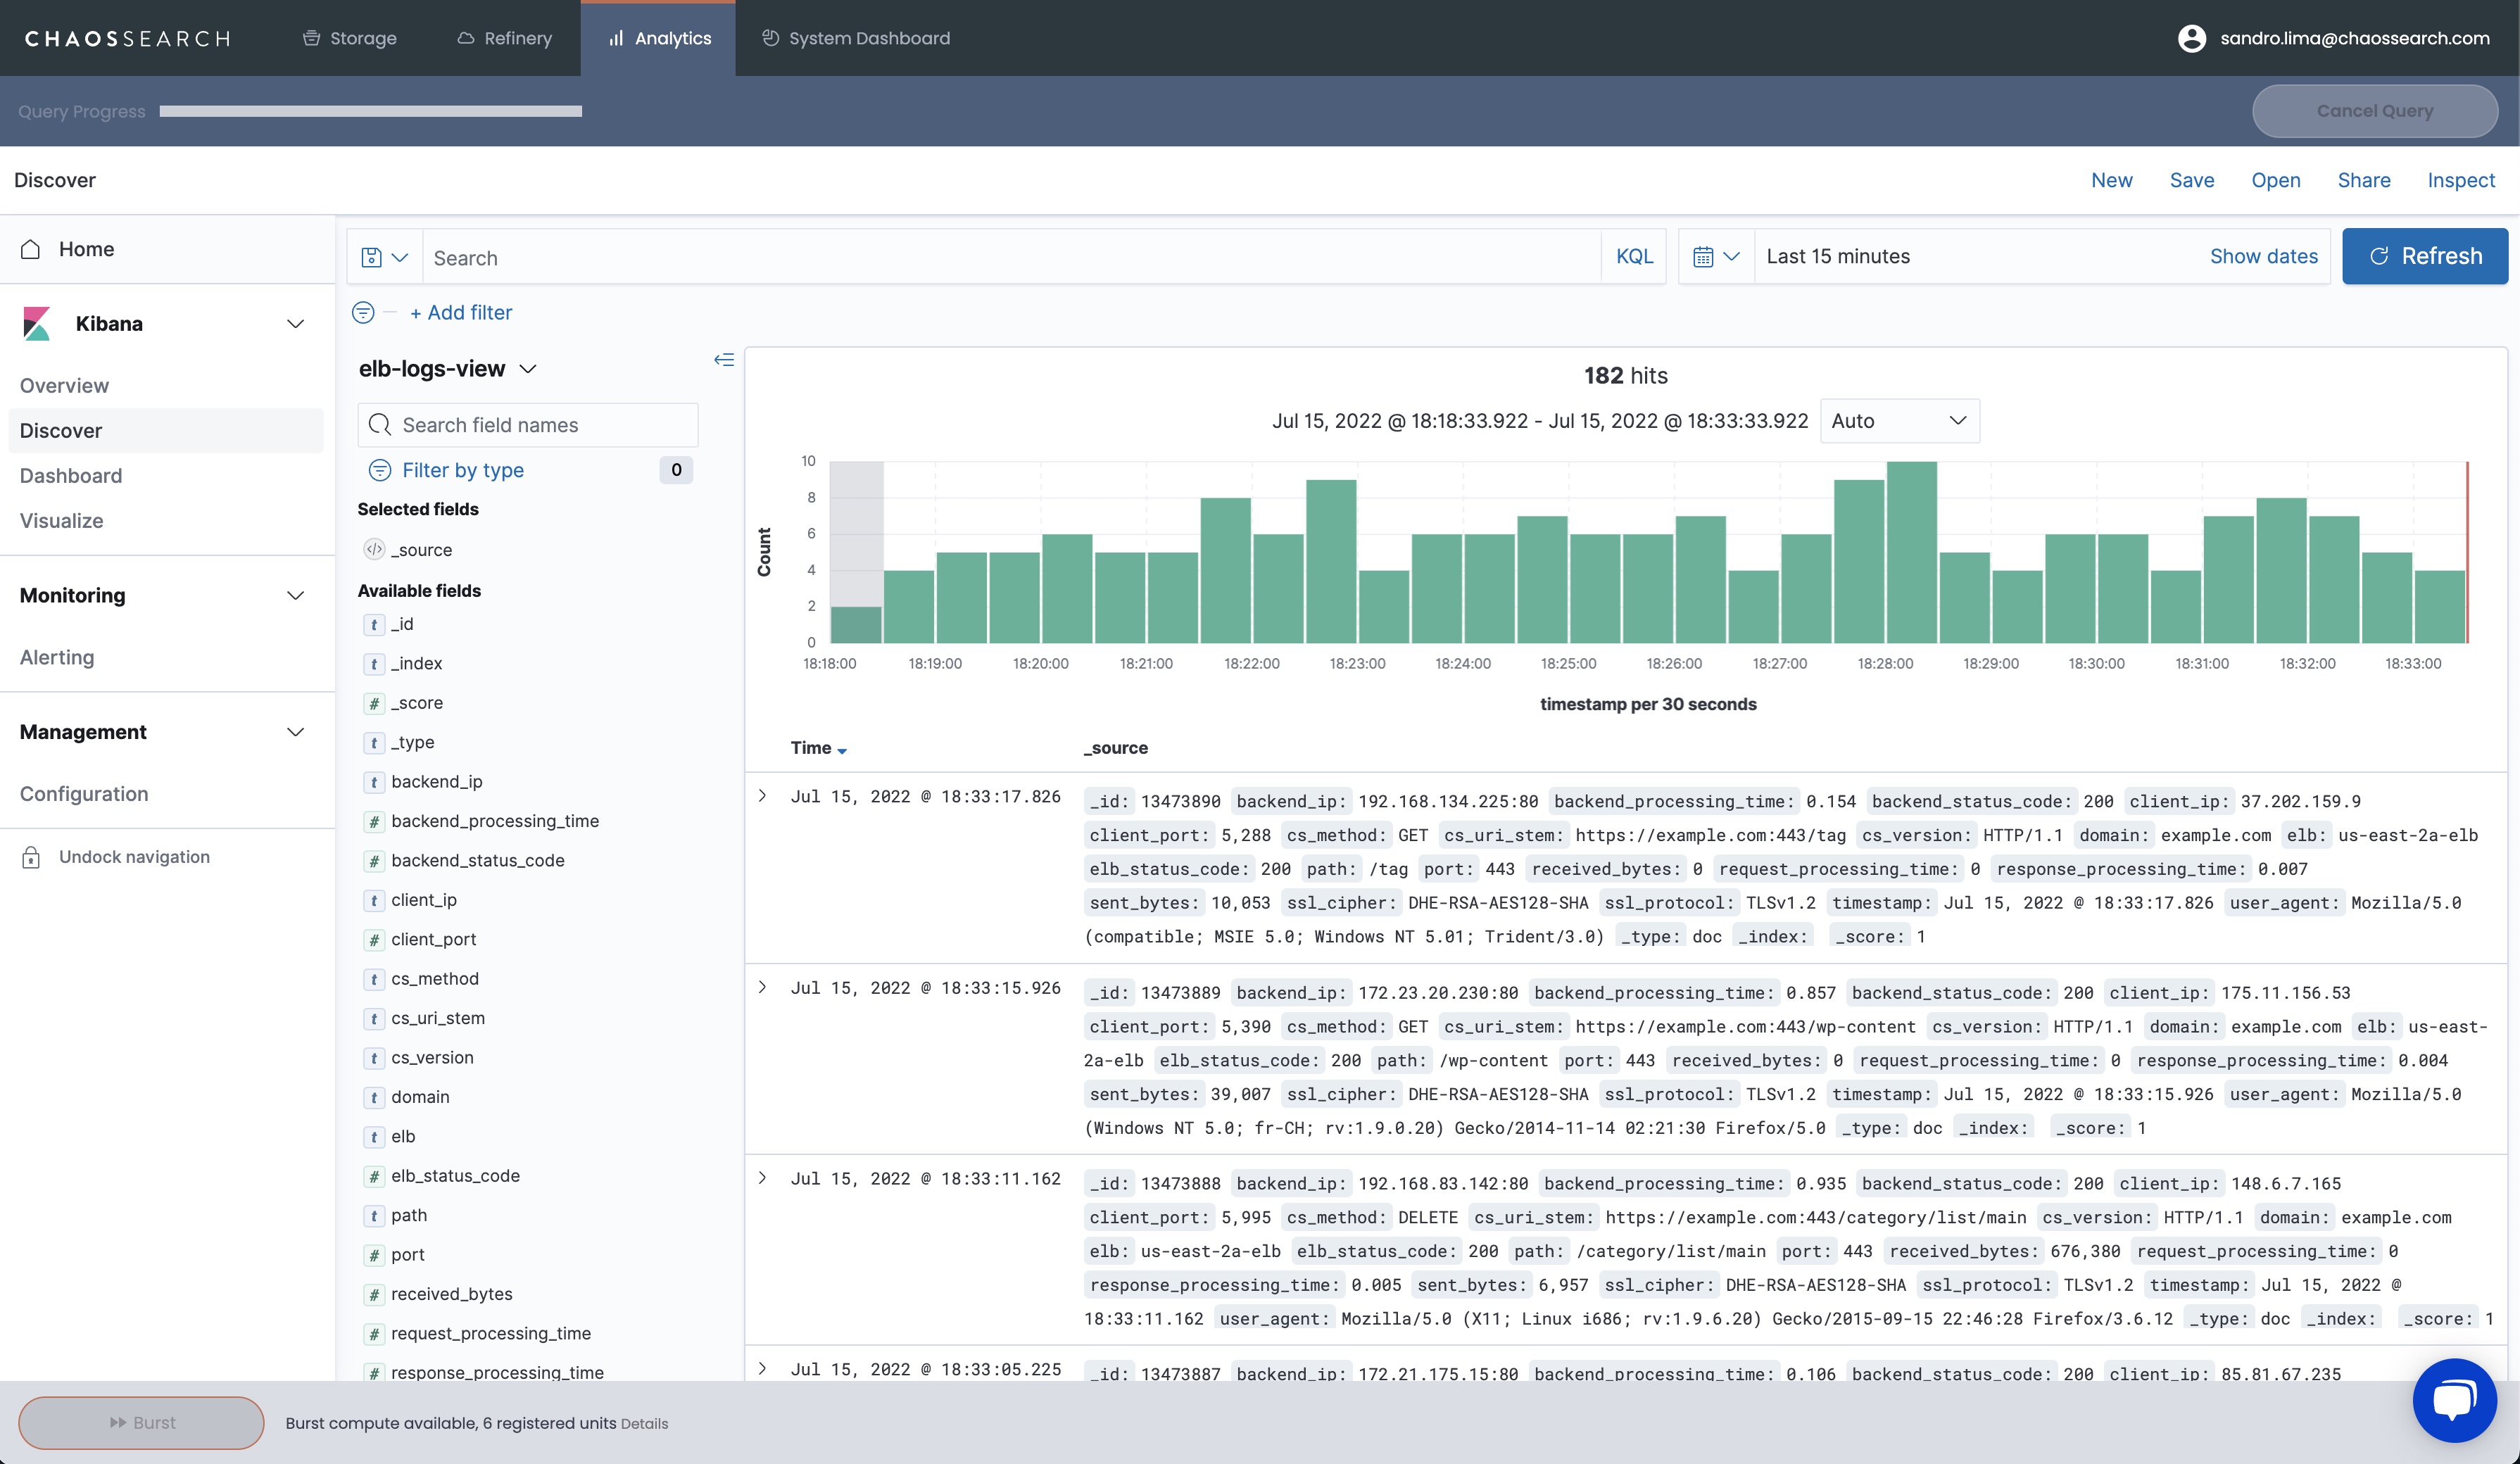
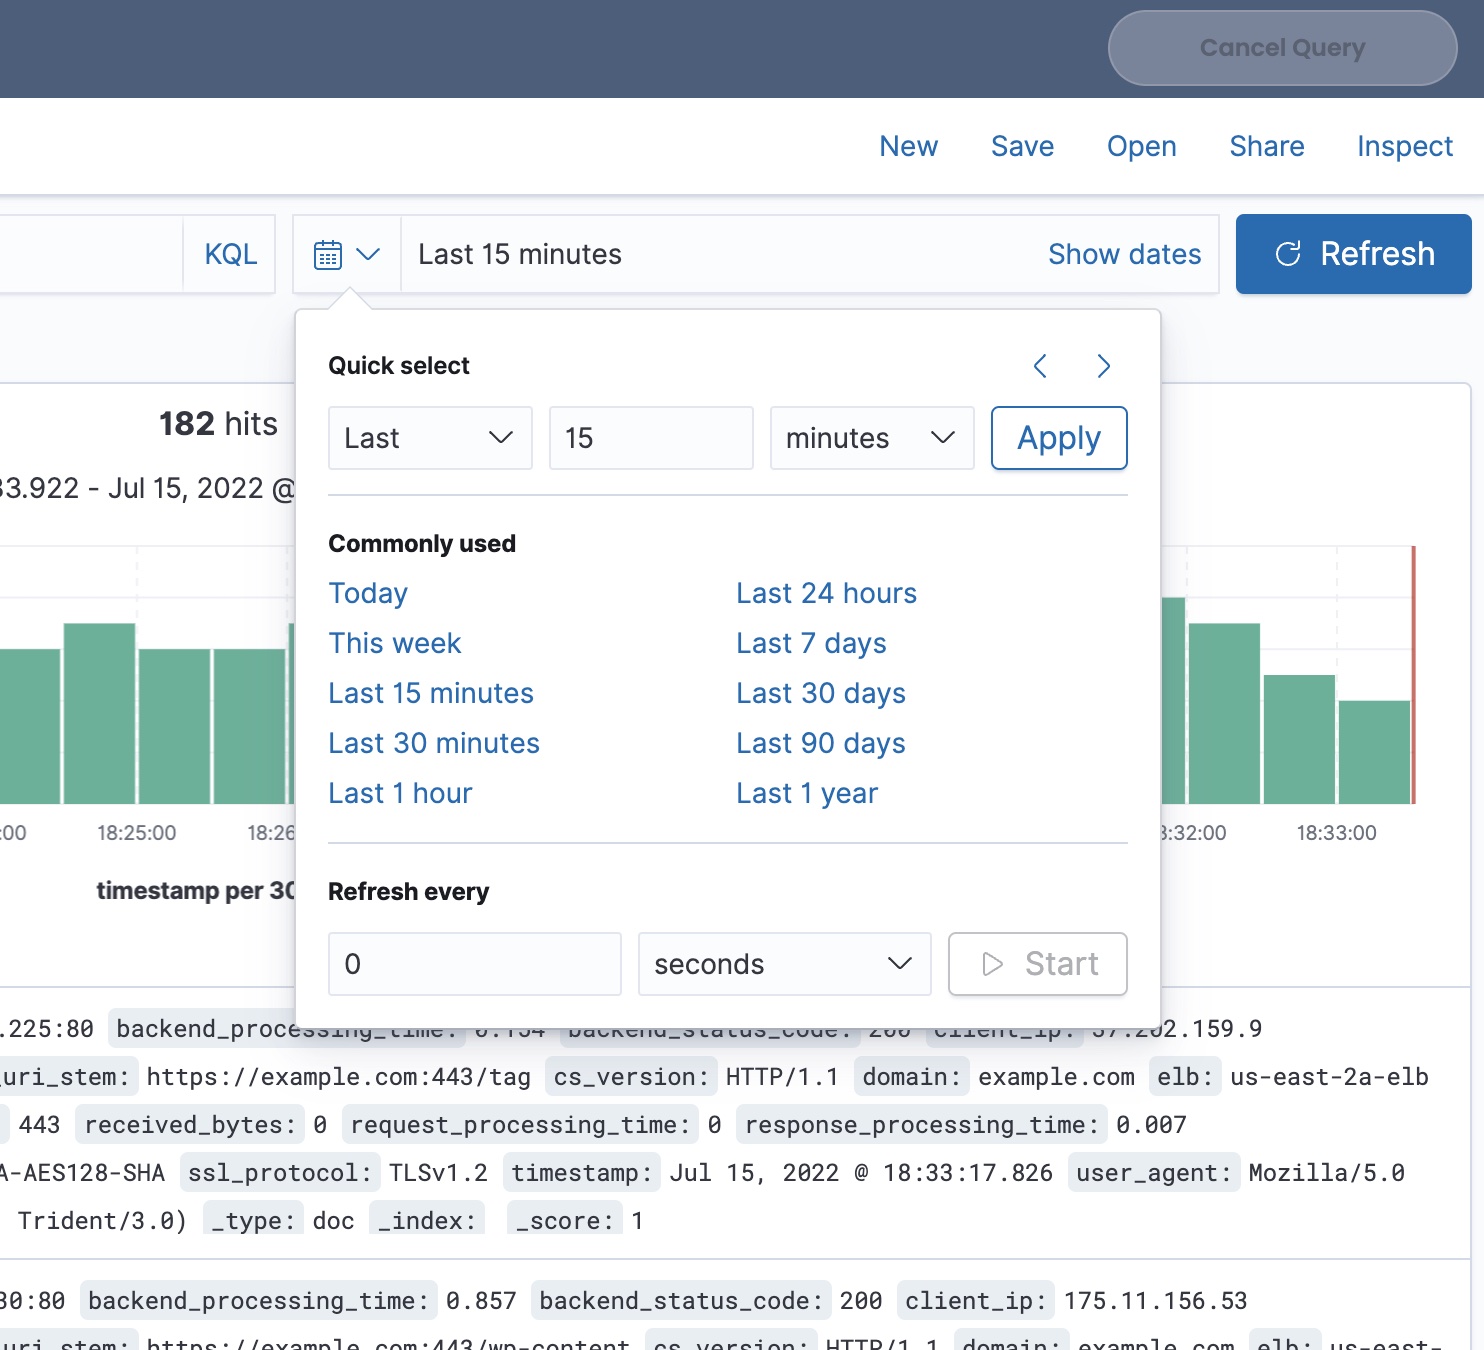
You can change the time filter at the top-right side of the screen.
The screen will show a histogram on the top, and a list of events. Click on the arrow on the left side of each event to get details.
Create filters
Let’s run a quick analysis and filter out “good requests” (Status Code: 200), leaving only requests with status codes indicating errors.
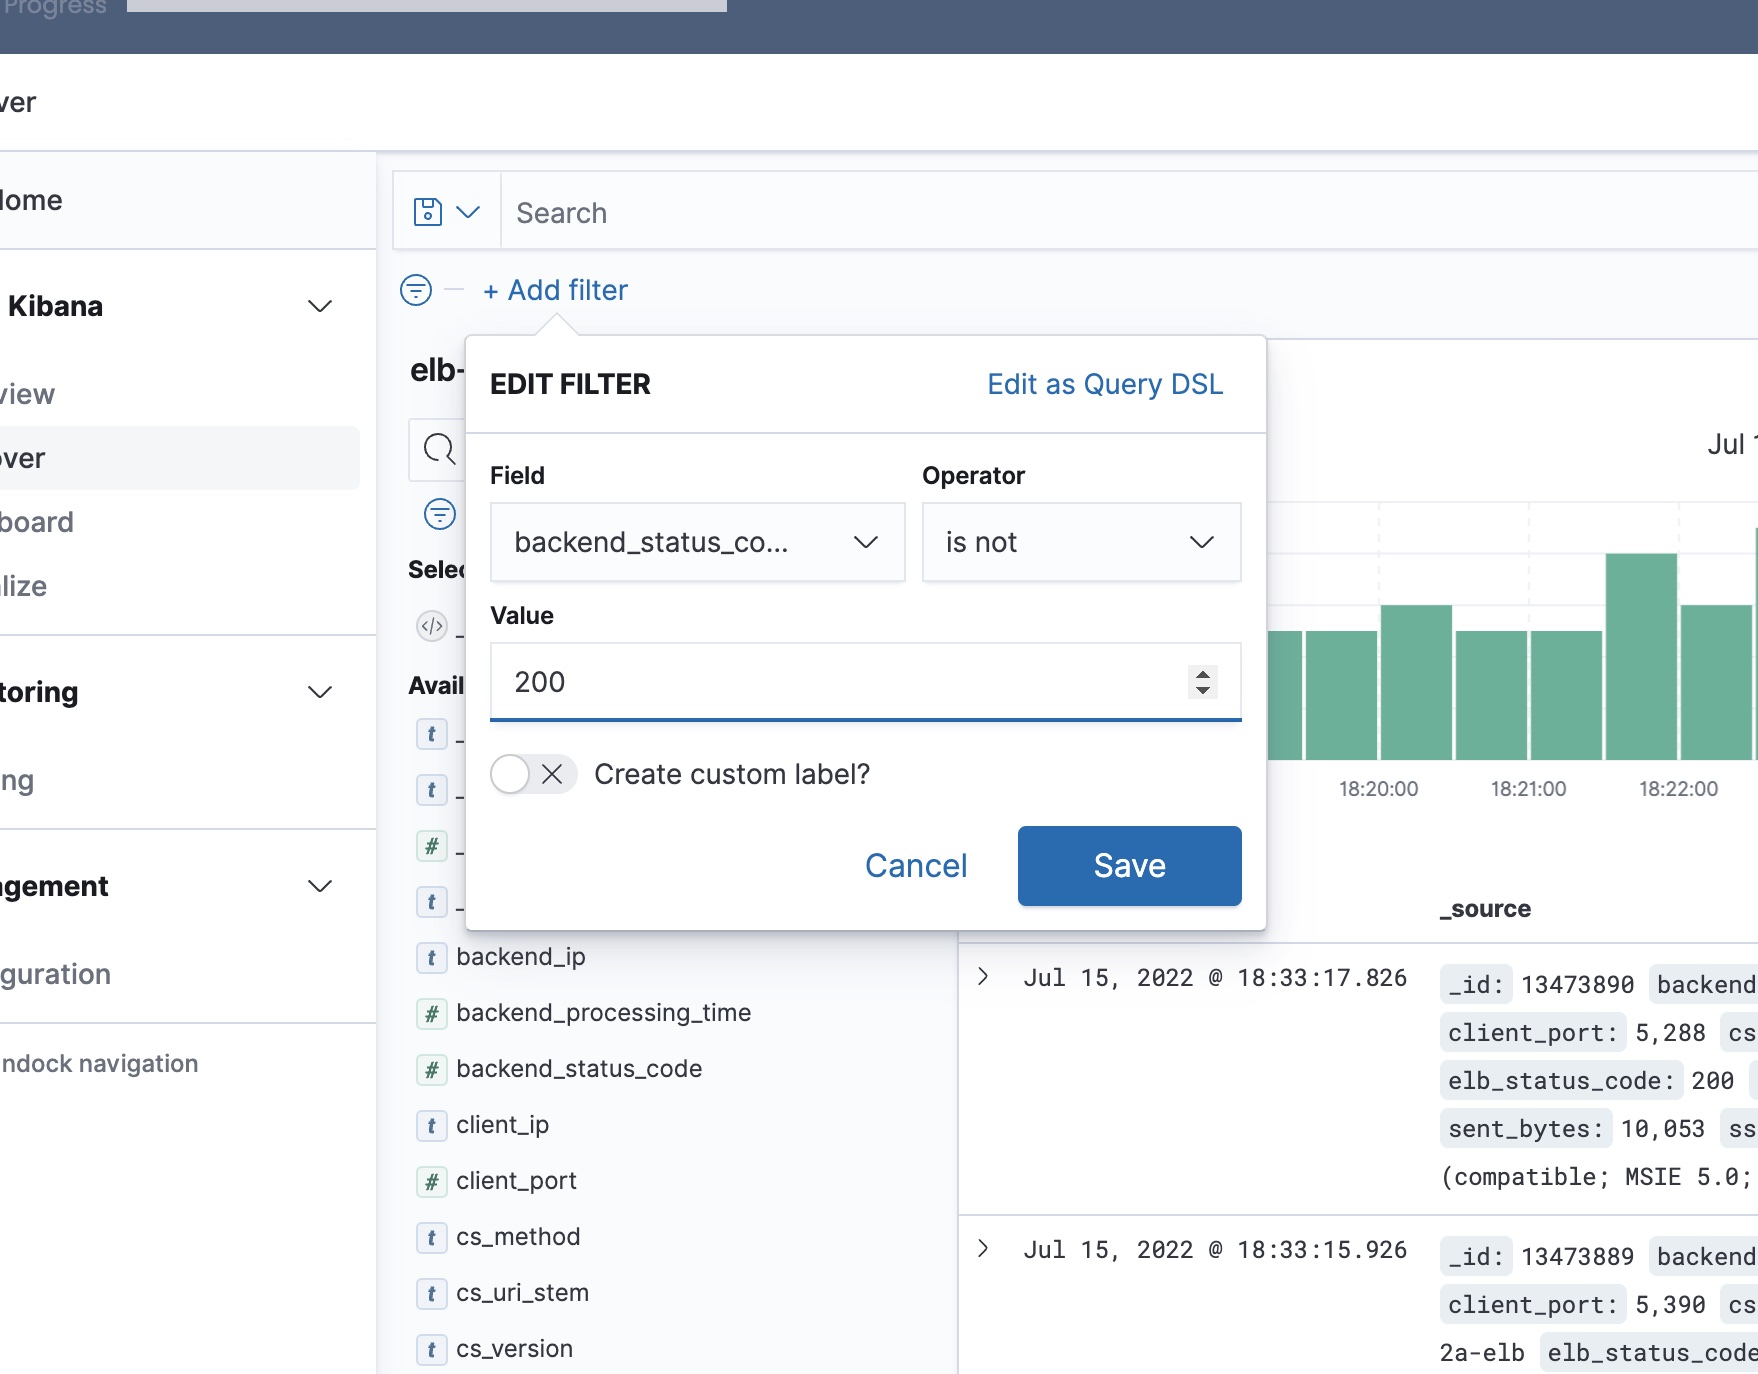
Select + Add Filter on the top left of the screen and enter the following information:
- Field: backend_status_code
- Operator: is not
- Value: 200
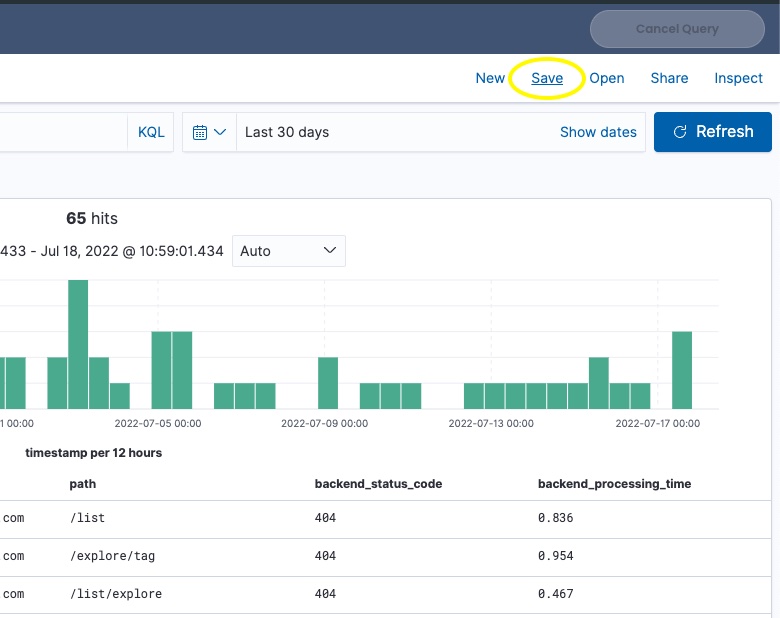
Click Save.
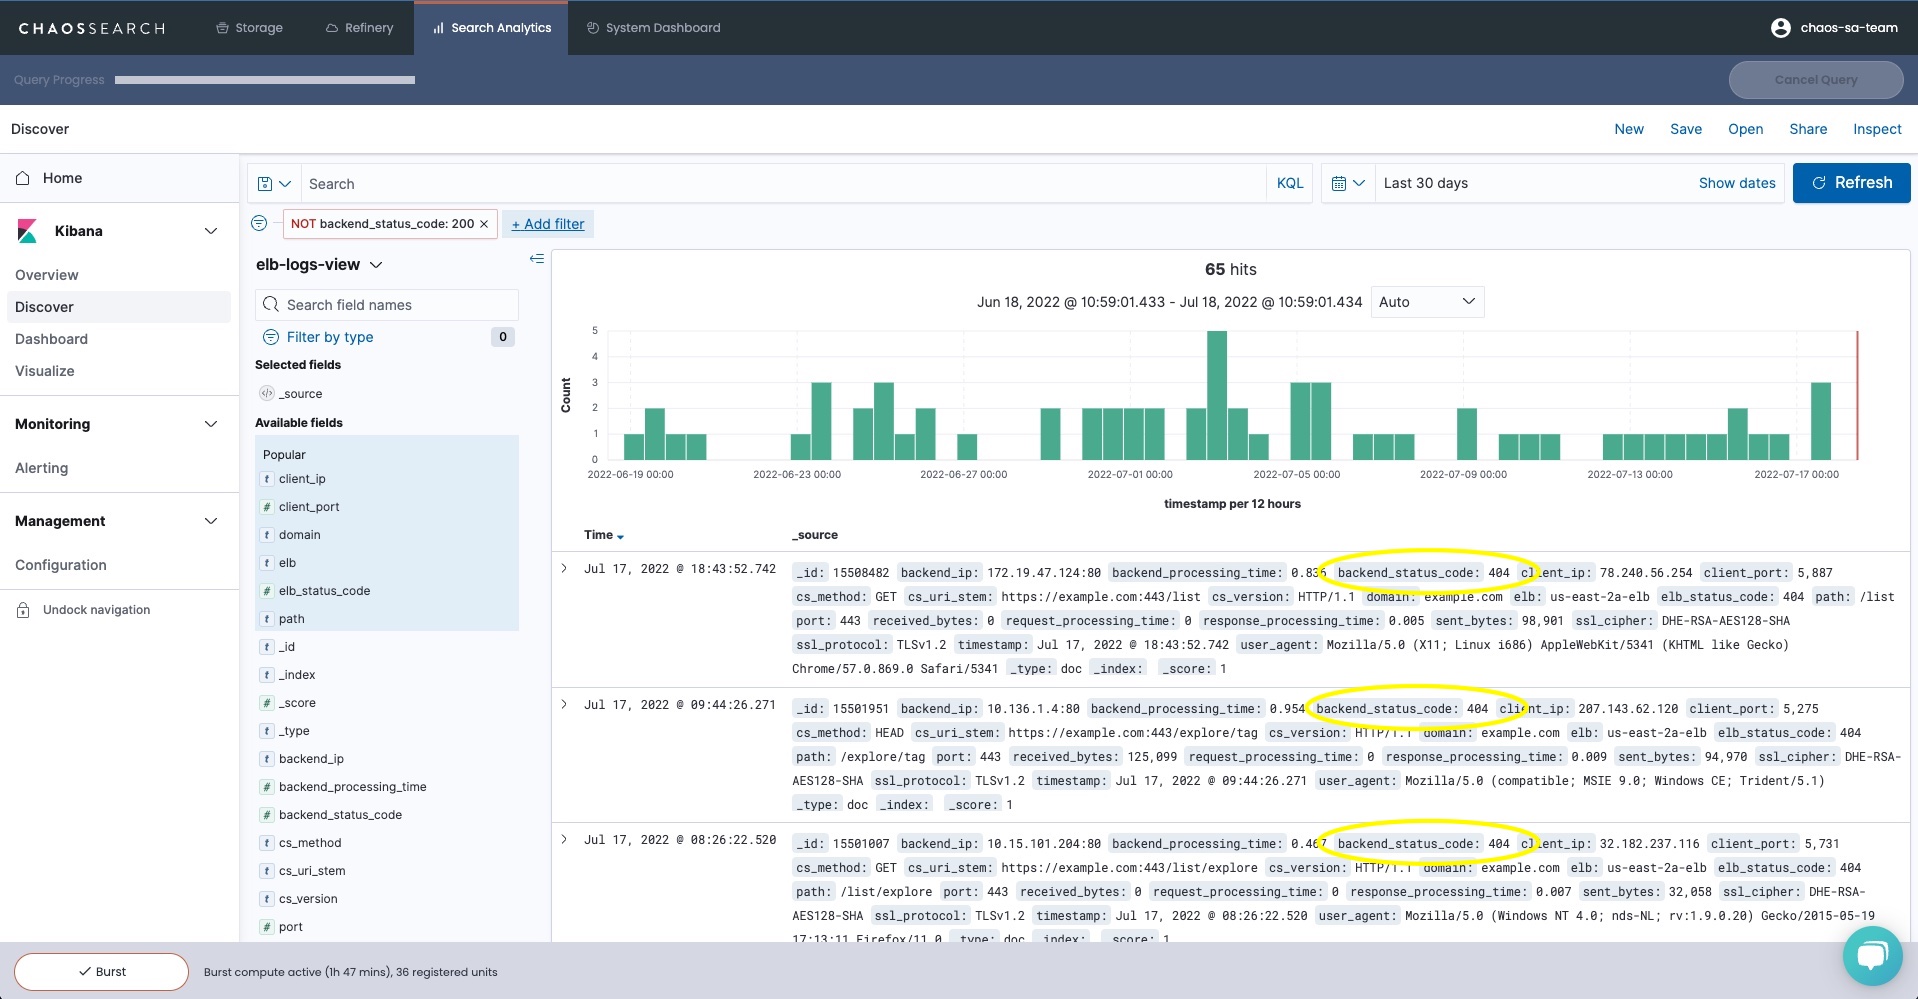
Info: If no results are returned after the filter is applied, change the time filter to “Last 30 days”
Check the results to verify that only requests with status codes different from 200 are listed.
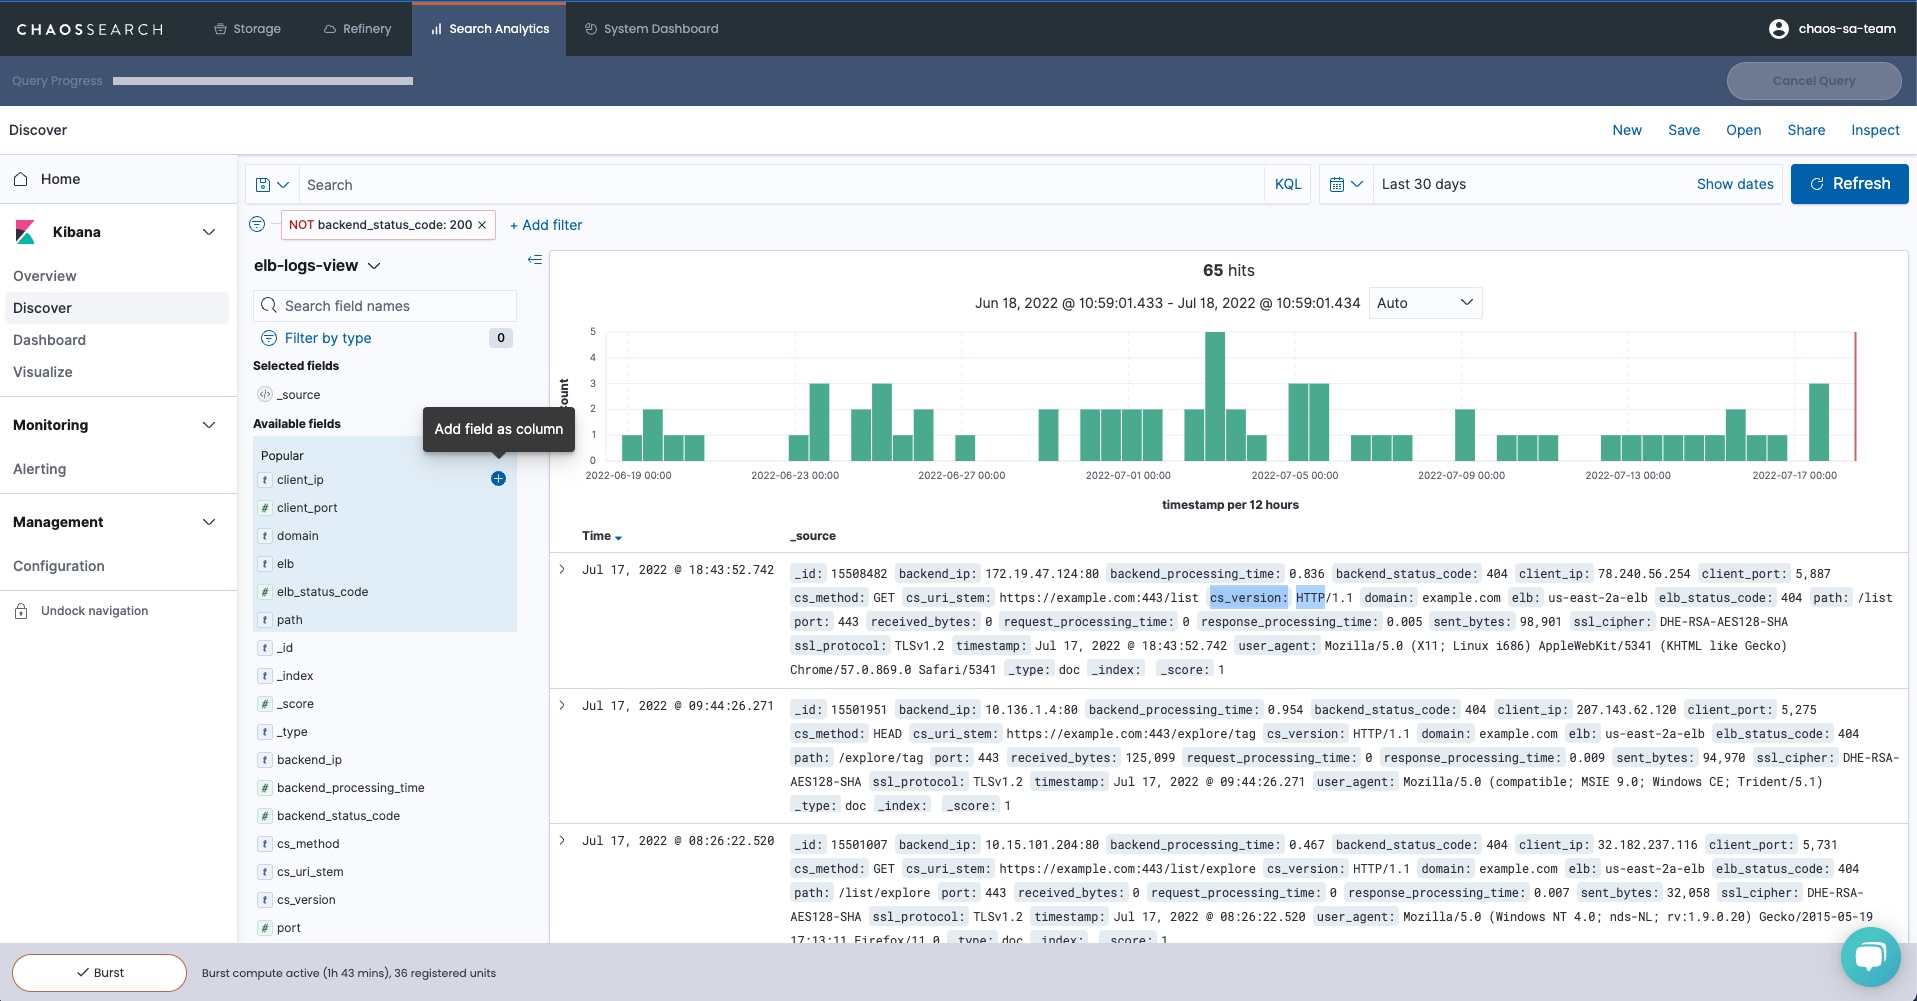
You can also click on the + icon on any of the available fields to customize the logs details and include only the fields selected:
For example, you can create a visualization by selecting the following fields:
- Client IP
- Client Port
- Domain
- Path
- Backend Status Code
- Backend Processing Time
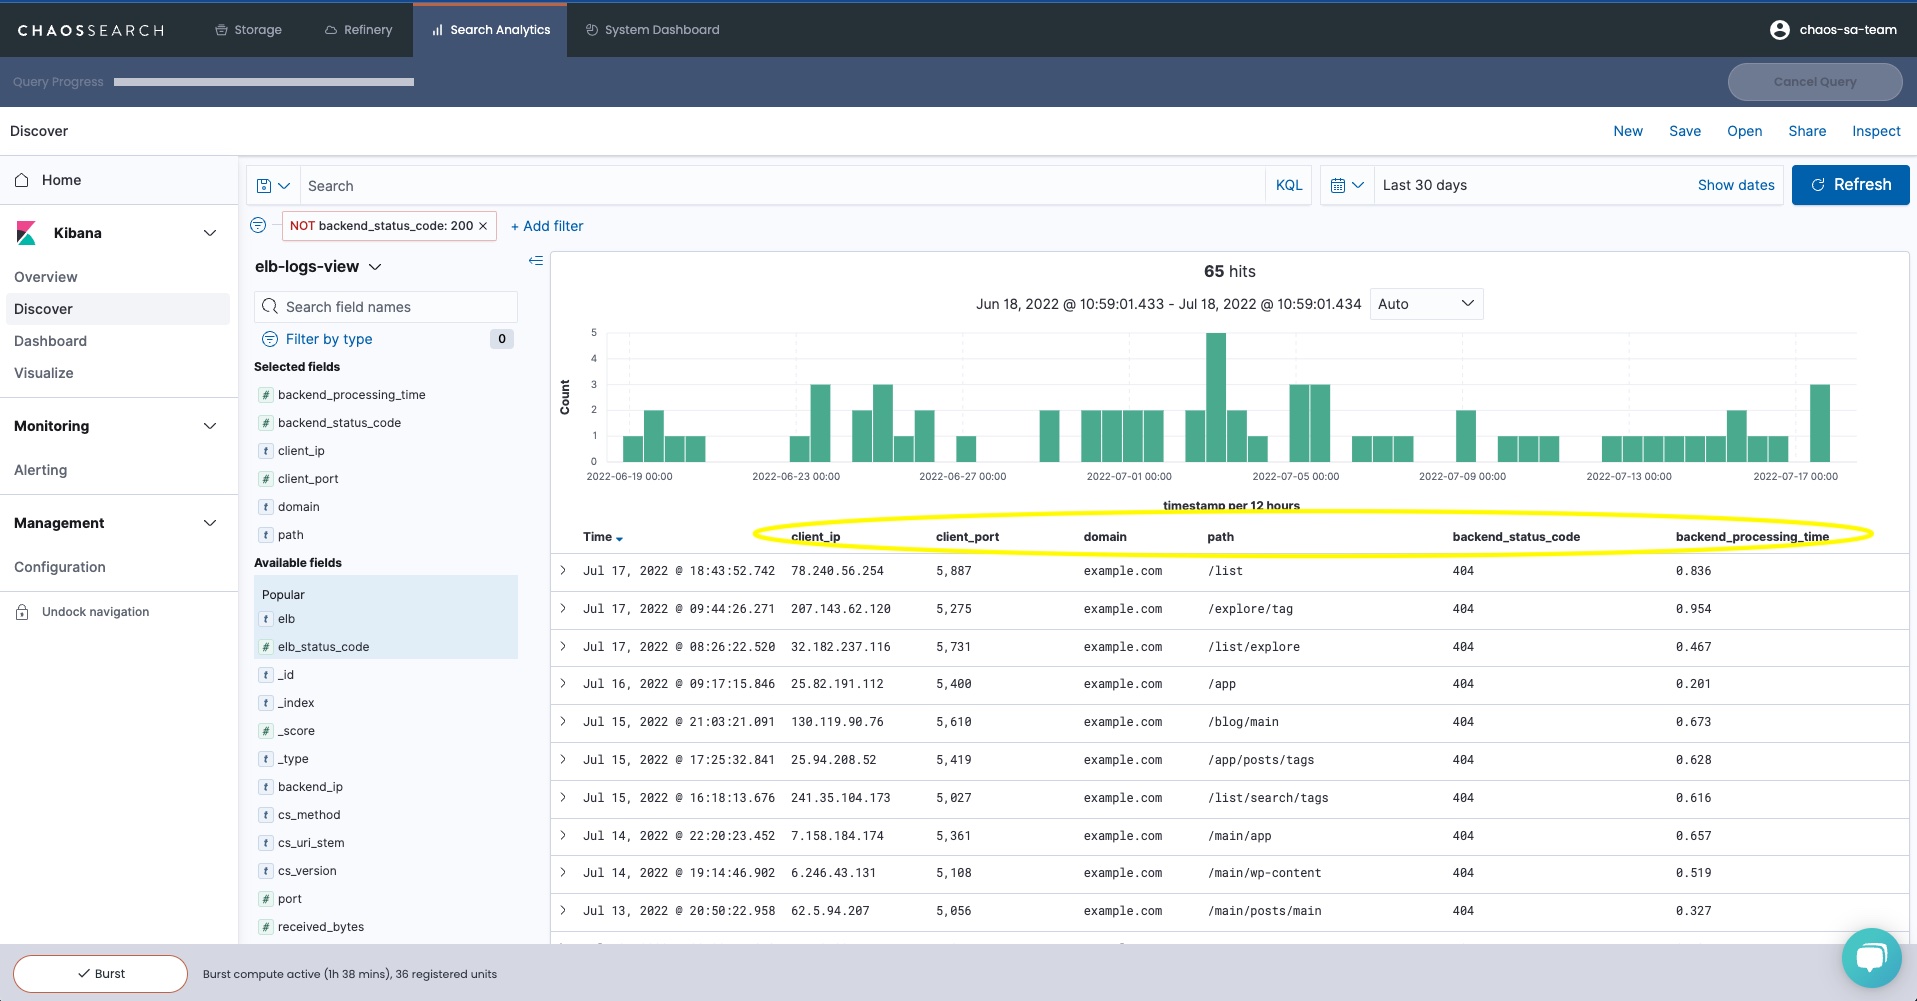
Finally, save the search by clicking Save and providing a name.